QRA Results view
The QRA Summary plot is the default view of the QRA Results view. The initial results are presented in this plot as the probability of success. Success means to prevent breakouts wider than the value entered in the parameter definition windows on the Depth Based PMW form, and to avoid lost circulation, which is defined by the upper bound of the mud window (Shmin or fracture gradient). If you define swab, ECD, or surge effects on the QRA form, the QRA output plots show the probability of avoiding borehole collapse curve both with and without these effects.
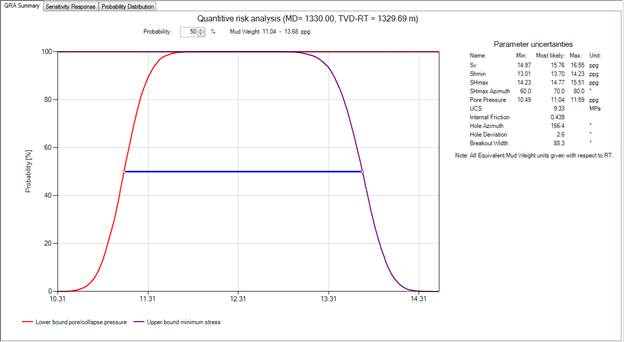
QRA Summary plot click to enlarge
In the plot, a horizontal blue bar extending from the upper mud weight bound to the lower mud weight bound allows you to interact with the plot to select the mud window with the desired degree of risk. You can then evaluate the relationship between risk and mud window by dragging the blue bar up or down to the desired probability of success.
If you have specified swab, surge and ECD effects, the results of the analysis are plotted as solid red and green lines in the QRA Summary plot. Note that the negative swab pressure shifts the lower bound to the right, and the positive ECD and surge pressures shift the upper bound to the left. The joint swab, ECD, and surge effects cause the final mud window to narrow, but the uncertainties affect the results in a non-linear way.
Sensitivity response
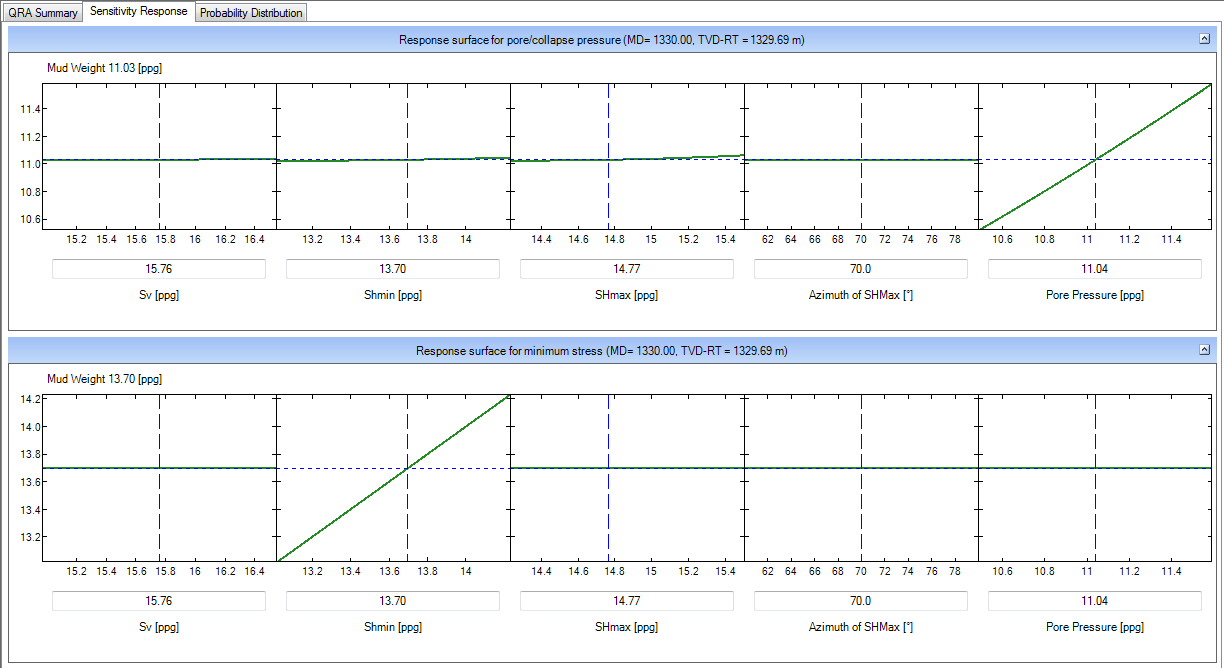
Sensitivity Response tab click to enlarge
Clicking the Sensitivity Response tab at the top of the QRA Results view produces a plot of the response surface for the selected bound, which illustrates how each of the input parameters affects the wellbore stability model. By default, both the lower and upper bound are plotted.
The response surface used in the QRA and Risk Assessment analyses is quadratic, i.e., the application considers mud weight a locally second-order polynomial function of the uncertain parameters. During the CASING QRA, unknown coefficients are calculated by performing eighty-one wellbore stability simulations, returning a precise value of mud weight for eighty-one combinations of input values that are selected according to a representative design matrix. The design matrix is based on the minimum, most likely, and maximum values of an input parameter as entered in the QRA parameter table in Step 3 of the workflow form. A linear regression technique is then used to fit a response surface to the data.
The QRA display contains a series of plots with the response surface for each input parameter, assuming all of the other parameters remain fixed. The green lines in each plot represent predicted mud weight and the red dashed lines indicate 99% confidence levels. The steepness of these curves indicates the sensitivity of the analysis result to the uncertainty in any given parameter; a steeper curve indicates greater sensitivity. The horizontal, blue dotted line in each plot is the mud weight that the application calculates for the fixed value of each parameter, as shown below that parameter’s plot and in the plot as a vertical, blue dashed line. The default fixed value is the most likely value entered in the parameter definition table. It may be changed either by entering a new value in the editable field or by dragging the vertical dashed line to a new position using the mouse. When one fixed value is changed, all other parameter plots update automatically.
A response surface plot is generated not only when the mud window bounds are calculated by the application, but also in cases for which you have defined a mud window bound by an input parameter (for example, Pore Pressure or the Least Stress). In such cases, the response surface QRA plot simply indicates that the value of interest is essentially independent of the other parameters and the response surface is flat.
Probability distribution
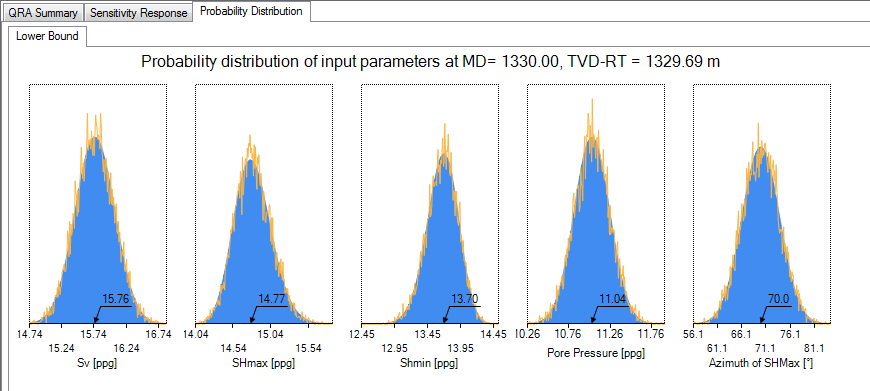
Probability Distribution tab click to enlarge
The Probability Distribution tab at the top displays probability distribution plots for the uncertainties associated with the parameters checked in the input parameter table in Step 3 of the workflow form. A graphical representation of the probability distributions of the input parameters used in the simulations is generated.
When the maximum and minimum values in the parameter definition window are symmetrical around the most likely value, the mean and standard deviation is calculated for a normal distribution and fits a Gaussian curve under the assumption that a randomly taken value lies with 99% probability within the maximum and minimum values. If the maximum and minimum values are asymmetrical around the most likely value, the application fits a log-normal curve to the distribution. Ten thousand random numbers are generated with a mean and standard deviation consistent with that calculated for the appropriate distribution and plots these as red curves for each distribution. These ten thousand random numbers are then used to calculate the probability of success distribution function in the QRA Summary plot.